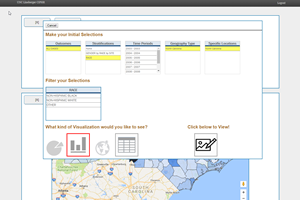
Good data deserves great design. We turn complex datasets into clear, engaging visuals that help stakeholders understand patterns, track progress, and make informed decisions. From energy generation trends to carbon impact metrics, we design dashboards and visual tools that cut through the noise.
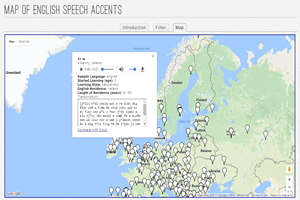
We work with trusted platforms like Power BI and Tableau for clients who need fast deployment, as well as custom-built web solutions using advanced libraries for charting, mapping, and interactivity. Whether you're visualizing grid congestion, renewable adoption, or facility-level performance, our visualizations make your story easy to explore—and impossible to ignore.